top of page

All Posts
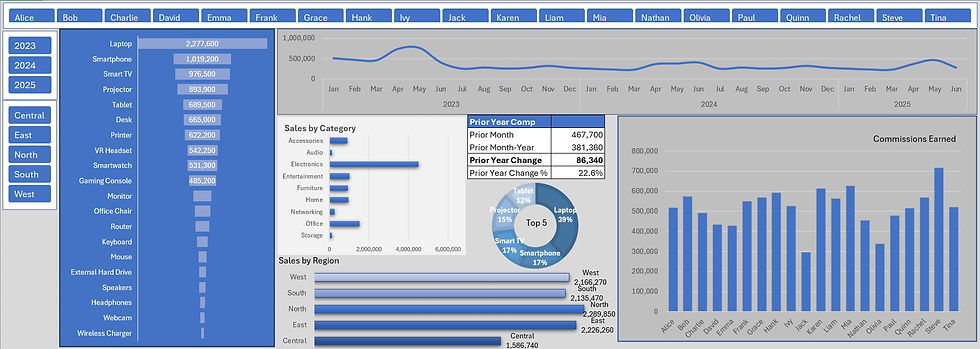
Your dashboard should serve as a strategic advisor.
Dynamic dashboard technology enhances the conventional dashboard experience by converting static data into interactive exchanges. Rather than simply displaying charts and figures, it engages users directly, interprets trends, and delivers real-time insights customized to individual requirements. This integration of data visualization and dialogue enables users to make informed decisions efficiently and fosters a more intuitive understanding of their data, encouraging thorough

Michael Davenport
Oct 24, 20252 min read
Breakeven Point: Where Clarity Meets Strategy
Sales Price per Unit This is your starting line. It’s the amount you earn for each product sold before any costs are deducted. Knowing...
Michael Davenport
Oct 7, 20252 min read
The Business Intelligence Journey: From First Conversation to Actionable Dashboard
Thinking about making data-driven decisions but unsure what the process looks like? Let me walk you through it - from our first...
Michael Davenport
Oct 2, 20252 min read
You don’t need a mountain of data to make smart decisions
In fact, the most powerful insights often come from the simplest sources - if you know how to look. Business intelligence (BI) isn’t...
Michael Davenport
Sep 24, 20252 min read
Choosing the correct chart for a dashboard is essential and should be guided by several key factors.
One important key to small business analytics is selecting the appropriate chart for data visualization which depends on both the...
Michael Davenport
Sep 8, 20252 min read
Key Performance Indicators
If you’re looking for your data, whether it's a data warehouse, lake, ocean, maybe your new and it’s just a puddle, to give you...
Michael Davenport
Sep 5, 20253 min read
bottom of page