
You don’t need a mountain of data to make smart decisions
- Michael Davenport
- Sep 24, 2025
- 2 min read

In fact, the most powerful insights often come from the simplest sources - if you know how to look. Business intelligence (BI) isn’t reserved for enterprise giants with sprawling databases. It’s a mindset, a toolkit, and a strategy that even the leanest operation can and should adopt.
Less can be more, especially while starting out. Starting with minimal data forces clarity. It strips away noise and focuses your attention on what truly matters:
Sales trends from just a few weeks can reveal seasonality or product momentum.
Inventory snapshots can expose bottlenecks or overstock risks.
Customer feedback - even a handful of comments - can guide product tweaks or messaging.
The goal isn’t to analyze everything. It’s to analyze what moves the needle.
Let’s get started!
Here’s a starter pack for small-scale BI (Business Intelligence):
Sales log (a simple Excel sheet)
Inventory count (manual or digital)
Basic KPIs like revenue, cost, margin, and units sold
Time stamps to track trends (daily, weekly, monthly)
That’s it.
How we’ll Structure It
Use Excel or Power BI to:
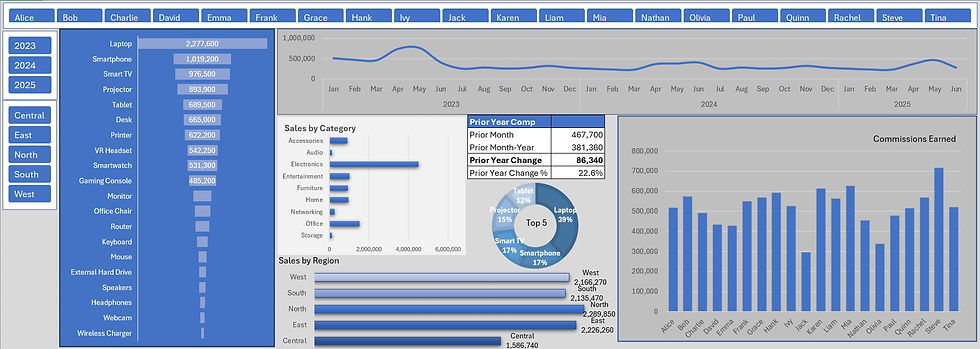
Create a dashboard with tiles for sales, inventory, and margin
Add filters by date, product, or location
Use conditional formatting to highlight wins and risks
Visualize trends with line charts, bar graphs, or even a simple sparkline
A dashboard can be created with just three columns of data, time, product and amount. This is all I need to begin building a tool to harness the power of data. Use business intelligence in the management of your business today.
You’re not just tracking - you’re storytelling. Every tile should answer a question: What’s working? What’s lagging? What needs attention?
From Data to Decisions
Once your dashboard is live:
Spot patterns (e.g., “Mondays are slow” or “Product X spikes after payday”)
Make micro-adjustments (e.g., reorder timing, promo scheduling)
Test hypotheses (e.g., “Does bundling increase average order value?”)
This is BI in action. It’s not about volume - it’s about velocity. Insights that lead to action.
Bonus: Add Intelligence, Not Just Information
Want to level up? Layer in:
Custom KPIs tailored to your business and industry
Macro overlays to align your business with broader trends
Branded visuals that make your dashboard feel like a product, not a spreadsheet
Final Thought
Business intelligence isn’t about having all the data. It’s about having the right data at the right time and knowing what to do with it. Start small, stay sharp, and build as you grow. Your dashboard is your compass. Even with minimal inputs, it can guide you to maximum impact and move the needle.
Comments