Transform data into decisions
Custom dashboards for inventory, sales, cost of goods sold, margins, pricing models, and more designed to drive smarter business growth.
My name is Michael Davenport
Equipping you with business intelligence tools to make data driven decisions.
Husband of 25 plus years, father, grandfather, I live in the Rainier area and serve the greater Olympia/Yelm area. My day may be filled with working around my property, spending time with family, volunteering at church, and or meeting friends for coffee or golf. I love spending time around a BBQ grill and a campfire. I have spent many years gaining the knowledge and experience, the tools necessary to utilize business intelligence. My dashboards don't just visualize data, they tell a story. I pride myself in transforming raw data into clarity so the right questions will be asked to find the right solution. My goal is to empower small business with tools that will make success enviable while also saving time.


Unlock Value
We'll help your businesses thrive by leveraging data analytics. This expertise empowers you to make informed decisions, drive growth, and achieve operational excellence.
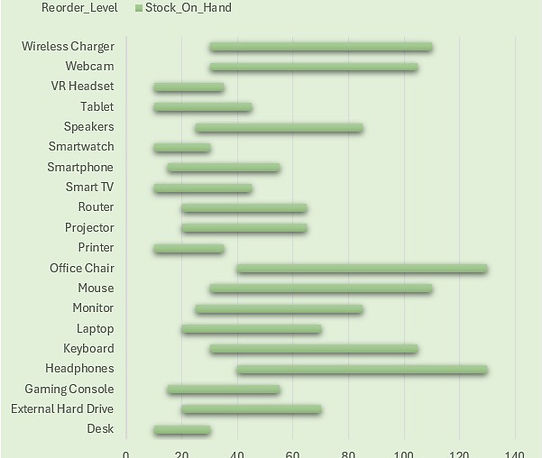
Your dashboard can be set up to track inventory and calculate its value. You can set reorder limits and restocking costs for items needed for production, resale, or storage. The visual shows a bar representing items above the reorder limit, which shrinks as items are used down to the set limit.
What would your data look like in your dashboard. What Key Performance Indicators (KPIs) would you include?
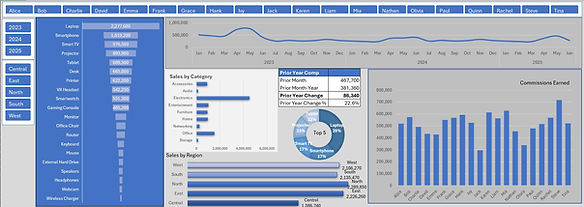
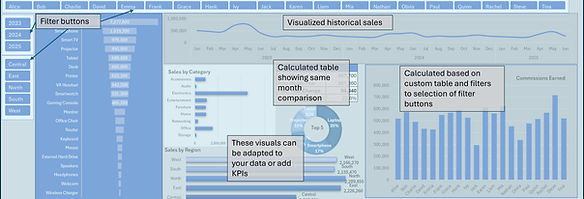
I use Excel to create a dashboard for analysis and storytelling. The data can be organized by date, category, item, region, salesperson. These can also be used as filters to see the revenue generated. Visualized data gives you the ability to spot customer trends. I created a bump in sales in the springtime, which you can "see" in the timeline on the upper right. Inventory tracking can be added, profit and loss, profit margin, and/or breakeven calculations can be added as well as Key Performance Indicators (KPIs). This can be informational as well as drive deeper questioning into the running of your business. Are you using your data to drive decision making? If you want to learn more, see a demo, talk about your data and how to use it. Send me a message and we'll begin on the journey to harness the power of your data.
Data is King
is a consulting business dedicated to helping organizations harness the power of data. Through tailored strategies and analytical solutions, we aim to transform how your business operates and grows.
Check out this video on a project management tool to track individual task as part of a larger project.

I harness the power of data to build data dashboards tailored to your business and goals. I focus on inventory tracking, sales analysis, and project management. While focusing on functionality we finish with something visually compelling. This allows the user the advantage of customized business intelligence. We can focus on customer analysis, inventory tracking, sales goals, and many other options.
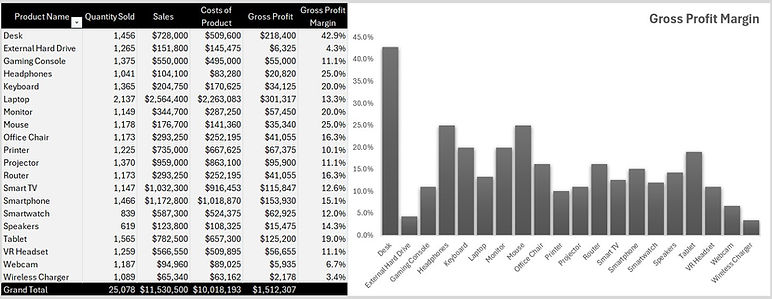
Do you want a better handle on your Gross Profit Margin? This is the percentage of sales remaining after the Cost of Goods Sold. How does your margin compare to industry standards? The remaining amount is what is left to run your business. Identify products that are the core of your business or those that add little value. Low-margin products might be essential supporting items. Tracking these will help you better understand this and your sales. This table and visual may raise more questions than answers, which will be beneficial. A dashboard can be configured to include this data. Contact me to start on a path to track these and many more metrics.
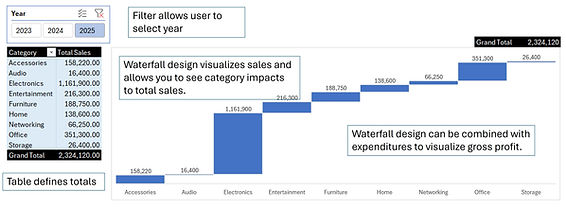
A waterfall graph is a powerful way to visualize category sales performance over time, making it ideal for tracking progress toward sales goals. Each column represents a segment of sales—starting with baseline figures and followed by increases or decreases from various activities such as promotions, returns, or seasonal trends. This step-by-step display highlights the cumulative impact of each factor, leading to the final sales outcome. Waterfall graphs help teams pinpoint which actions are driving growth or causing setbacks, facilitating more informed strategy adjustments. By breaking down complex data into a digestible narrative, this format transforms raw numbers into actionable insights that support goal alignment and performance optimization.